
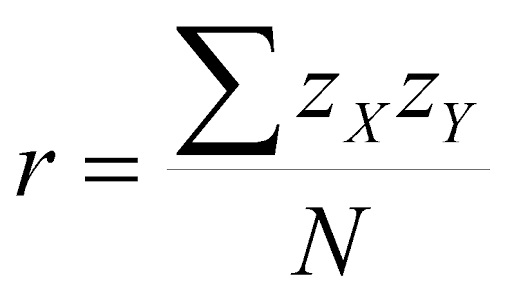
Statistics refers to the study of collection, organization, analysis, interpretation, and presentation of data. Correlation Coefficient is an important topic in statistics. It is a statistical concept, which helps in establishing a relation between predicted and actual values obtained in a statistical experiment. Its calculated value explains the exactness between the predicted and actual values. It shows how strong a relationship is between two variables.
As far as the JEE exam is concerned, statistics is an important topic. We can find the Pearson’s correlation coefficient by dividing the covariance of two variables by the product of their standard deviations. It is denoted by the symbol ρ (rho). The value of ρ always lies between -1 to +1. If the value is positive, then there is a similar and identical relation between the two variables. Otherwise, it indicates the dissimilarity between the two variables. In this article, we will learn the formula, assumptions, and examples.
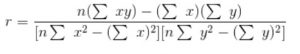
Formula
ρ (X,Y) = cov (X,Y) / σX.σY.
Here cov represents covariance. σX is the standard deviation of X and σY is the standard deviation of Y. The given equation for ρ can be expressed in terms of means and expectations.
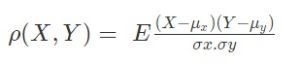
In the above equation, μx and μy are mean of x and mean of y respectively. E is the expectation.
Pearson’s coefficient formula is given below.
Assumptions of Karl Pearson’s Correlation Coefficient
The following are the assumptions and requirements for the calculation of ρ.
- The data sets to be correlated should approximate the normal distribution. In such data, most data points tend to hover close to the mean.
- Homoscedasticity refers to equal variances. The error term will be the same for all the values of the independent variable. If the error term is smaller for a certain set of values of the independent variable and larger for another set of values, then homoscedasticity is violated. We can check it visually through a scatter plot. If the points lie equally on both sides of the line of best fit, then the data is said to be homoscedastic.
- If the data follow a linear relationship, it is said to be linearity. The data satisfies the condition of linearity If the data points are in the form of a straight line on the scatter plot.
- The variables that can take any value in an interval are continuous variables. There should be continuous variables in the data set to calculate the Pearson coefficient. Spearman’s rank correlation is an appropriate measure If one of the data sets is ordinal.
- The data points must be in pairs which are known as paired observations. For every observation of the independent variable, there exists a dependent variable.
- There should not be outliers in the data. If they are present, then they can skew the Pearson coefficient and make it inappropriate. If a point is beyond +3.29 or -3.29 standard deviations away, then it is considered as an outlier. It can be found visually from a scatter plot.
Students are recommended to practise the previous year questions so that they can have an idea about what type of questions are asked from this topic. Let us have a look at an example of Statistics JEE Previous Year Questions With Solutions. The step by step solutions will help students to quickly understand the problems.
Example:
The median of a set of 9 distinct observations is 20.5. If each of the largest 4 observations of the set is increased by 2, then the median of the new set is:
Solution:
Given median = 20.5
n = 9.
So median will be [(n+1)/2]th term = (9+1)/10 = 5th term
The last four observations are increased by 2.
Since the median is the 5th term, it will remain unchanged.
Hence the median of the new set = 20.5